Live Conflict Maps: 5 Best Tools to Track Wars and Military Operations in Real Time
Live conflict maps have become essential tools for anyone following military operations in real time. During the 2026 US-Iran war, millions of people turned to live conflict maps to track strikes, naval movements, and the Strait of Hormuz closure. But with multiple platforms available, which live conflict maps are the most reliable and comprehensive?
This guide reviews the best live conflict maps available in 2026, explains how they work, what data they use, and how to interpret them effectively. Whether you are a journalist, analyst, investor, or concerned citizen, understanding live conflict maps will help you stay informed with verified information rather than rumors and speculation.
How Live Conflict Maps Work
Live conflict maps aggregate data from multiple sources and plot events geographically. The best platforms combine OSINT tracking methods including news reports, official military statements, satellite imagery, flight tracking, and ship tracking data. Events are typically categorized by type (strike, naval, diplomatic, etc.) and displayed as markers on interactive maps.
The key difference between live conflict maps is how they handle verification. Some platforms plot every unconfirmed social media report, creating noise and potentially spreading misinformation. The best platforms verify events against multiple sources before displaying them, similar to War Intel Hub’s 3-tier verification system.
5 Best Live Conflict Maps in 2026
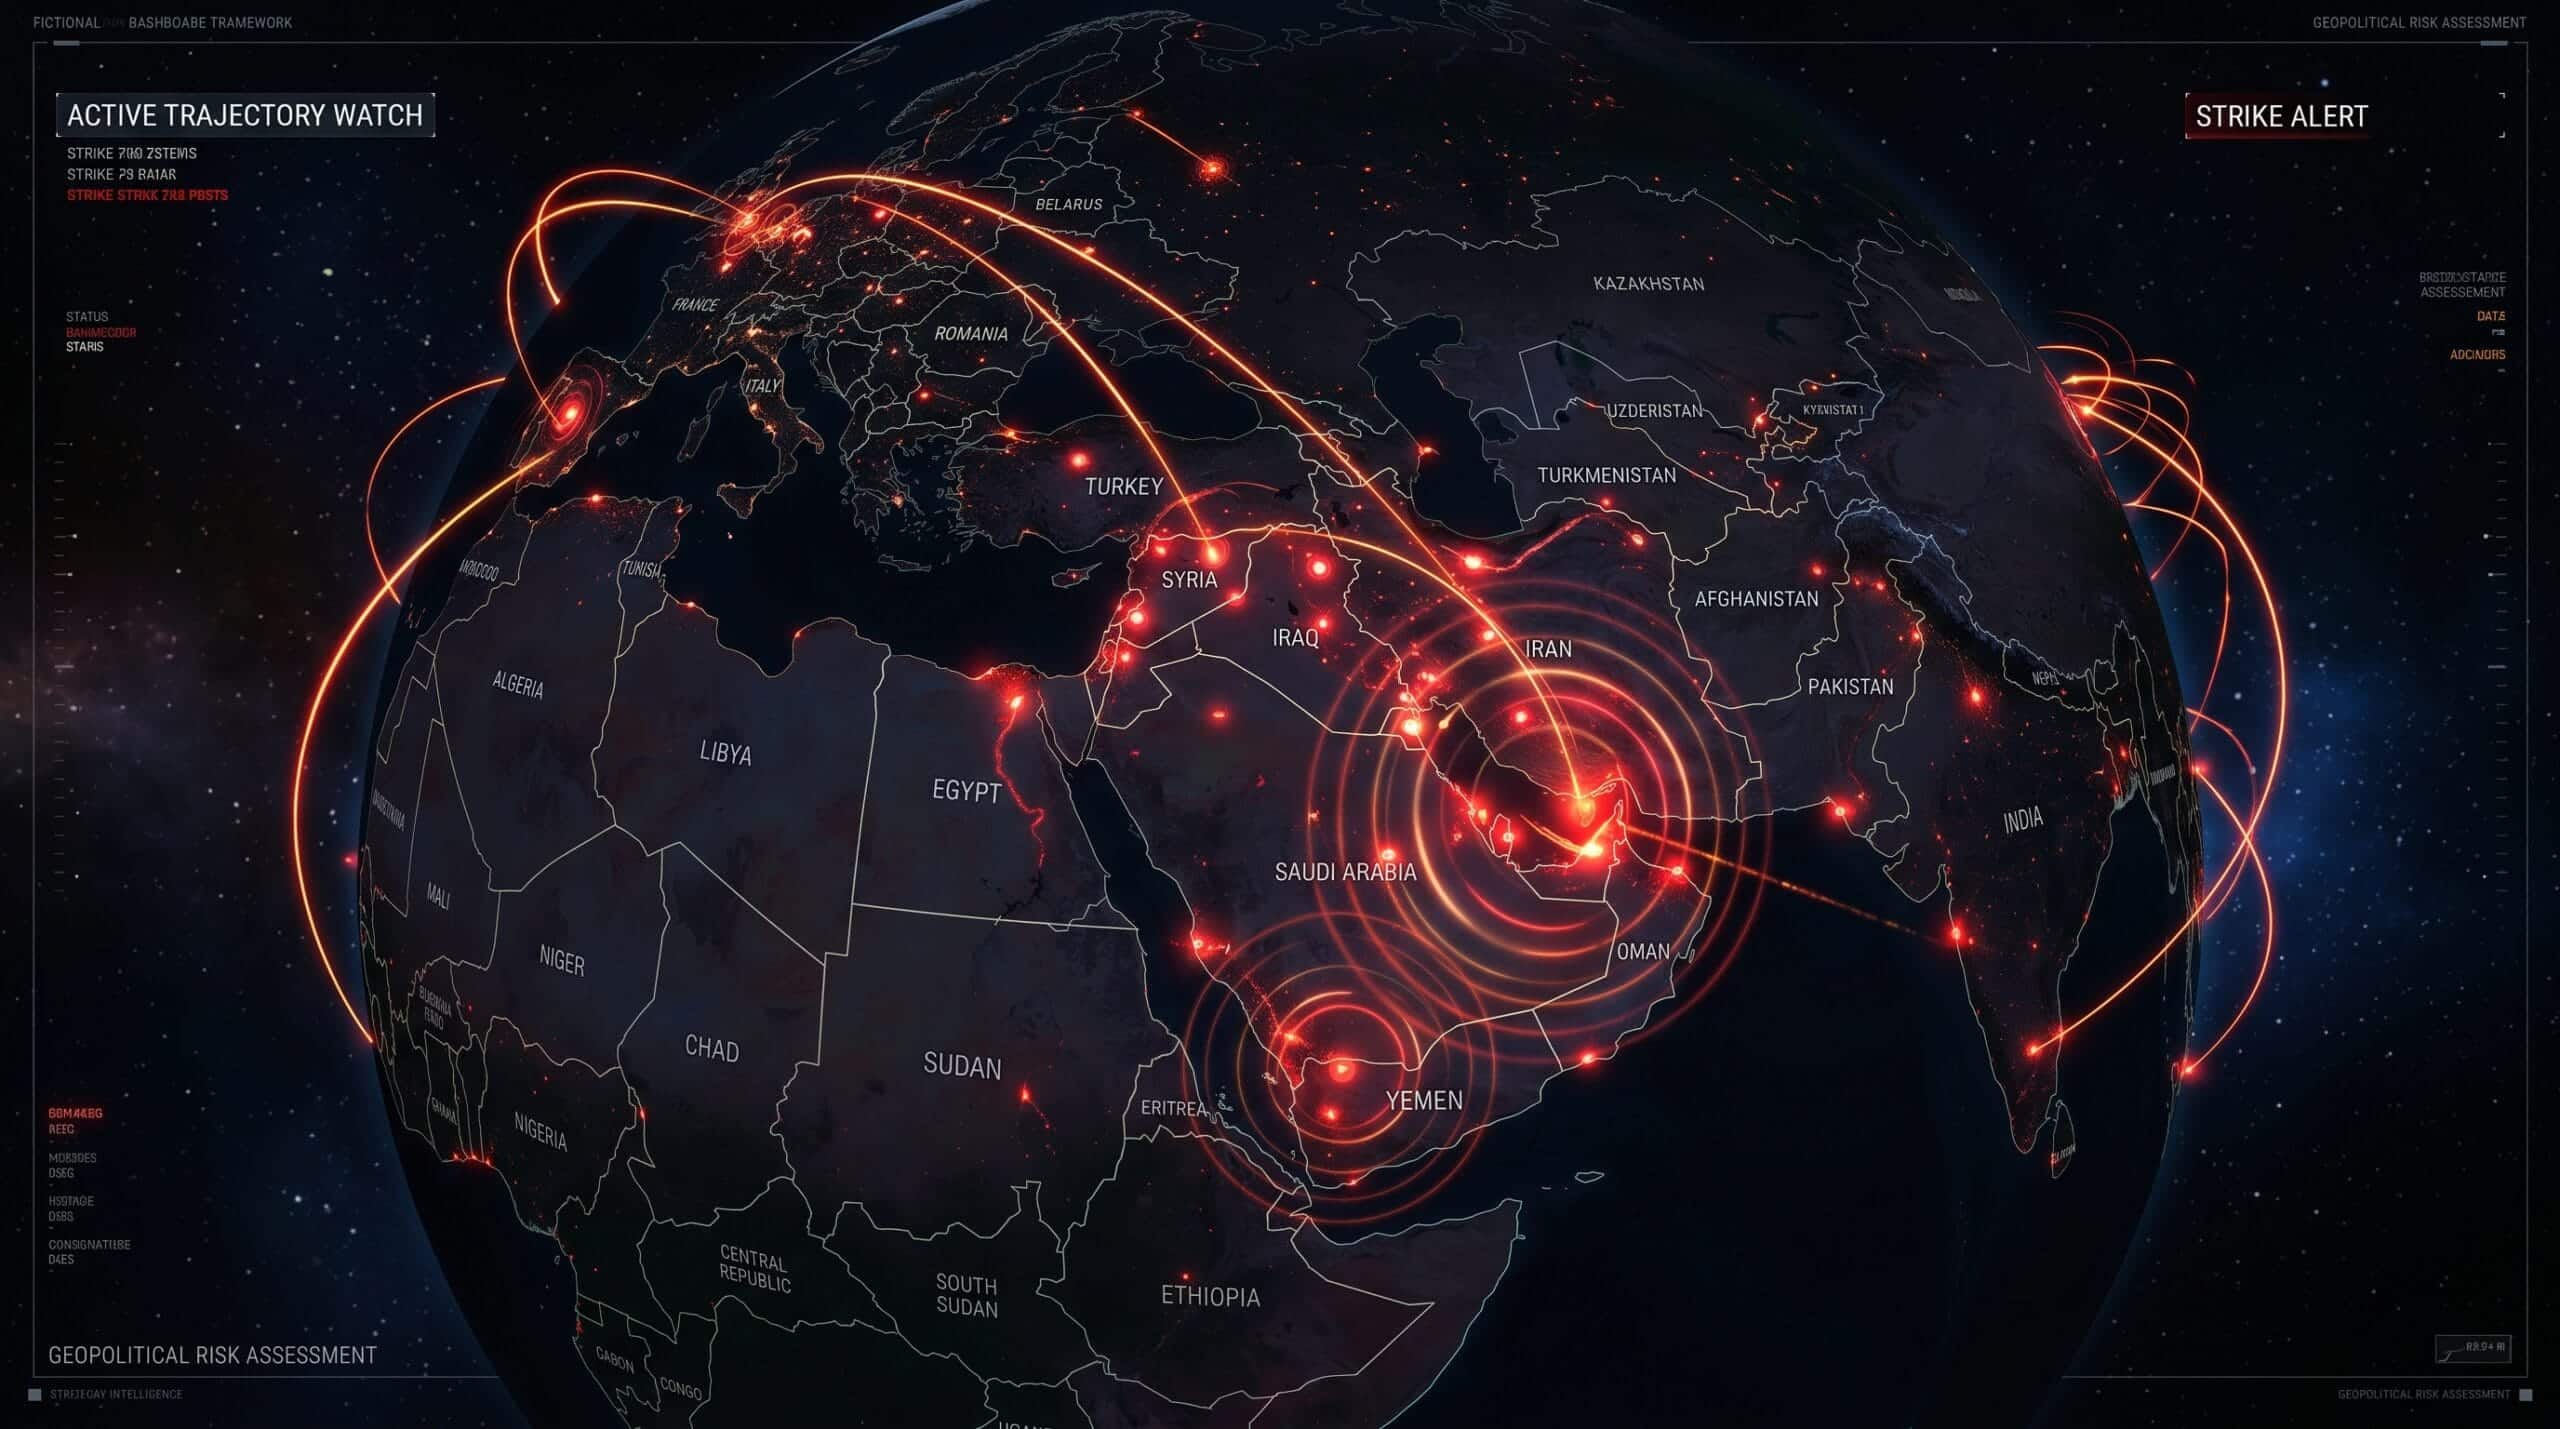
1. War Intel Hub — 3D Strike Map
Our 3D strike map uses Globe.gl to display verified conflict events on an interactive 3D globe. Each strike point shows location, weapon type, casualty data, and source attribution. Animated arc trajectories visualize attack vectors between origin and target. The map auto-refreshes every 60 seconds from our verified strike database, which is curated through a manual review process — no unverified events appear on the map.
Strengths: Source-verified data, weapon and casualty breakdowns, per-side statistics, 3D visualization with attack arcs
Data sources: Reuters, AP, Al Jazeera, BBC, CENTCOM, curated OSINT
2. Liveuamap
Liveuamap is one of the most established live conflict maps, covering multiple conflicts worldwide. It uses a 2D map interface with color-coded markers for different types of events. Events are primarily sourced from social media and news reports, with editorial curation by the Liveuamap team.
Strengths: Covers multiple conflicts globally, established track record, large analyst community
Limitations: Some events plotted before full verification, 2D interface only
3. ACLED (Armed Conflict Location & Event Data)
ACLED is an academic data project that records political violence and protest events worldwide. Unlike real-time conflict maps, ACLED focuses on systematic, research-grade data collection with standardized coding. Data is typically published with a delay of days to weeks but is considered highly reliable for research purposes.
Strengths: Academic rigor, standardized methodology, historical data archives
Limitations: Not real-time — data published with significant delay
4. Google Earth / Sentinel Hub — Satellite Imagery
While not conflict maps per se, satellite imagery platforms allow users to verify strike damage, troop movements, and infrastructure changes independently. Sentinel Hub provides free medium-resolution satellite imagery, while commercial services like Planet Labs and Maxar offer higher resolution. OSINT analysts frequently use before/after satellite comparisons to verify or debunk claims.
Strengths: Visual evidence, independent verification, historical comparisons
Limitations: Requires expertise to interpret, cloud cover interference, imagery delay
5. Flightradar24 / MarineTraffic — Transport Tracking
These platforms track aircraft (via ADS-B) and ships (via AIS) in real time. During conflicts, they reveal airspace closures, military aircraft movements, shipping disruptions, and naval deployments. War Intel Hub integrates both into our dedicated air traffic monitor and maritime tracker pages.
Strengths: Objective data (positions are factual, not interpreted), real-time updates
Limitations: Military assets can turn off transponders, AIS spoofing possible
How to Read a Live Conflict Map Effectively
Not all markers on a live conflict map carry equal weight. Here is how to interpret them critically:
- Check the verification status — Is the event verified, corroborated, or unverified? Treat unverified markers with significant caution
- Look at the source — Is it from a wire service (high reliability), official statement (biased but authoritative), or social media (lowest reliability)?
- Consider the timestamp — How recent is the event? Older events may have been updated or contradicted
- Cross-reference — Never rely on a single map or platform. Compare across multiple sources
- Understand limitations — Live conflict maps show what has been reported, not necessarily what has happened. The fog of war means information is always incomplete
War Intel Hub: A Complete Live Conflict Map Platform
War Intel Hub combines multiple live conflict map tools into a single platform specifically designed for the 2026 US-Iran conflict:
- 3D Strike Map — verified strikes with weapon types, casualty data, and attack vectors on an interactive globe
- Air Traffic Monitor — real-time ADS-B aircraft tracking over the Middle East via OpenSky Network
- Maritime Tracker — Strait of Hormuz shipping monitor with live AIS data, port status, and conflict zones
- Live Dashboard — aggregated conflict feed with strike statistics, news headlines, and market data
- Daily SITREPs — intelligence briefings published at 0600 UTC covering all aspects of the conflict
All data is verified using our OSINT verification methodology before publication. Every event includes source attribution so users can independently verify claims.
Explore All Our Live Conflict Maps
3D strikes, air traffic, ship tracking — all verified and source-attributed.
Open 3D Strike Map →