Oil Price Impact of the Iran War: What the 2026 Conflict Means for Energy Markets
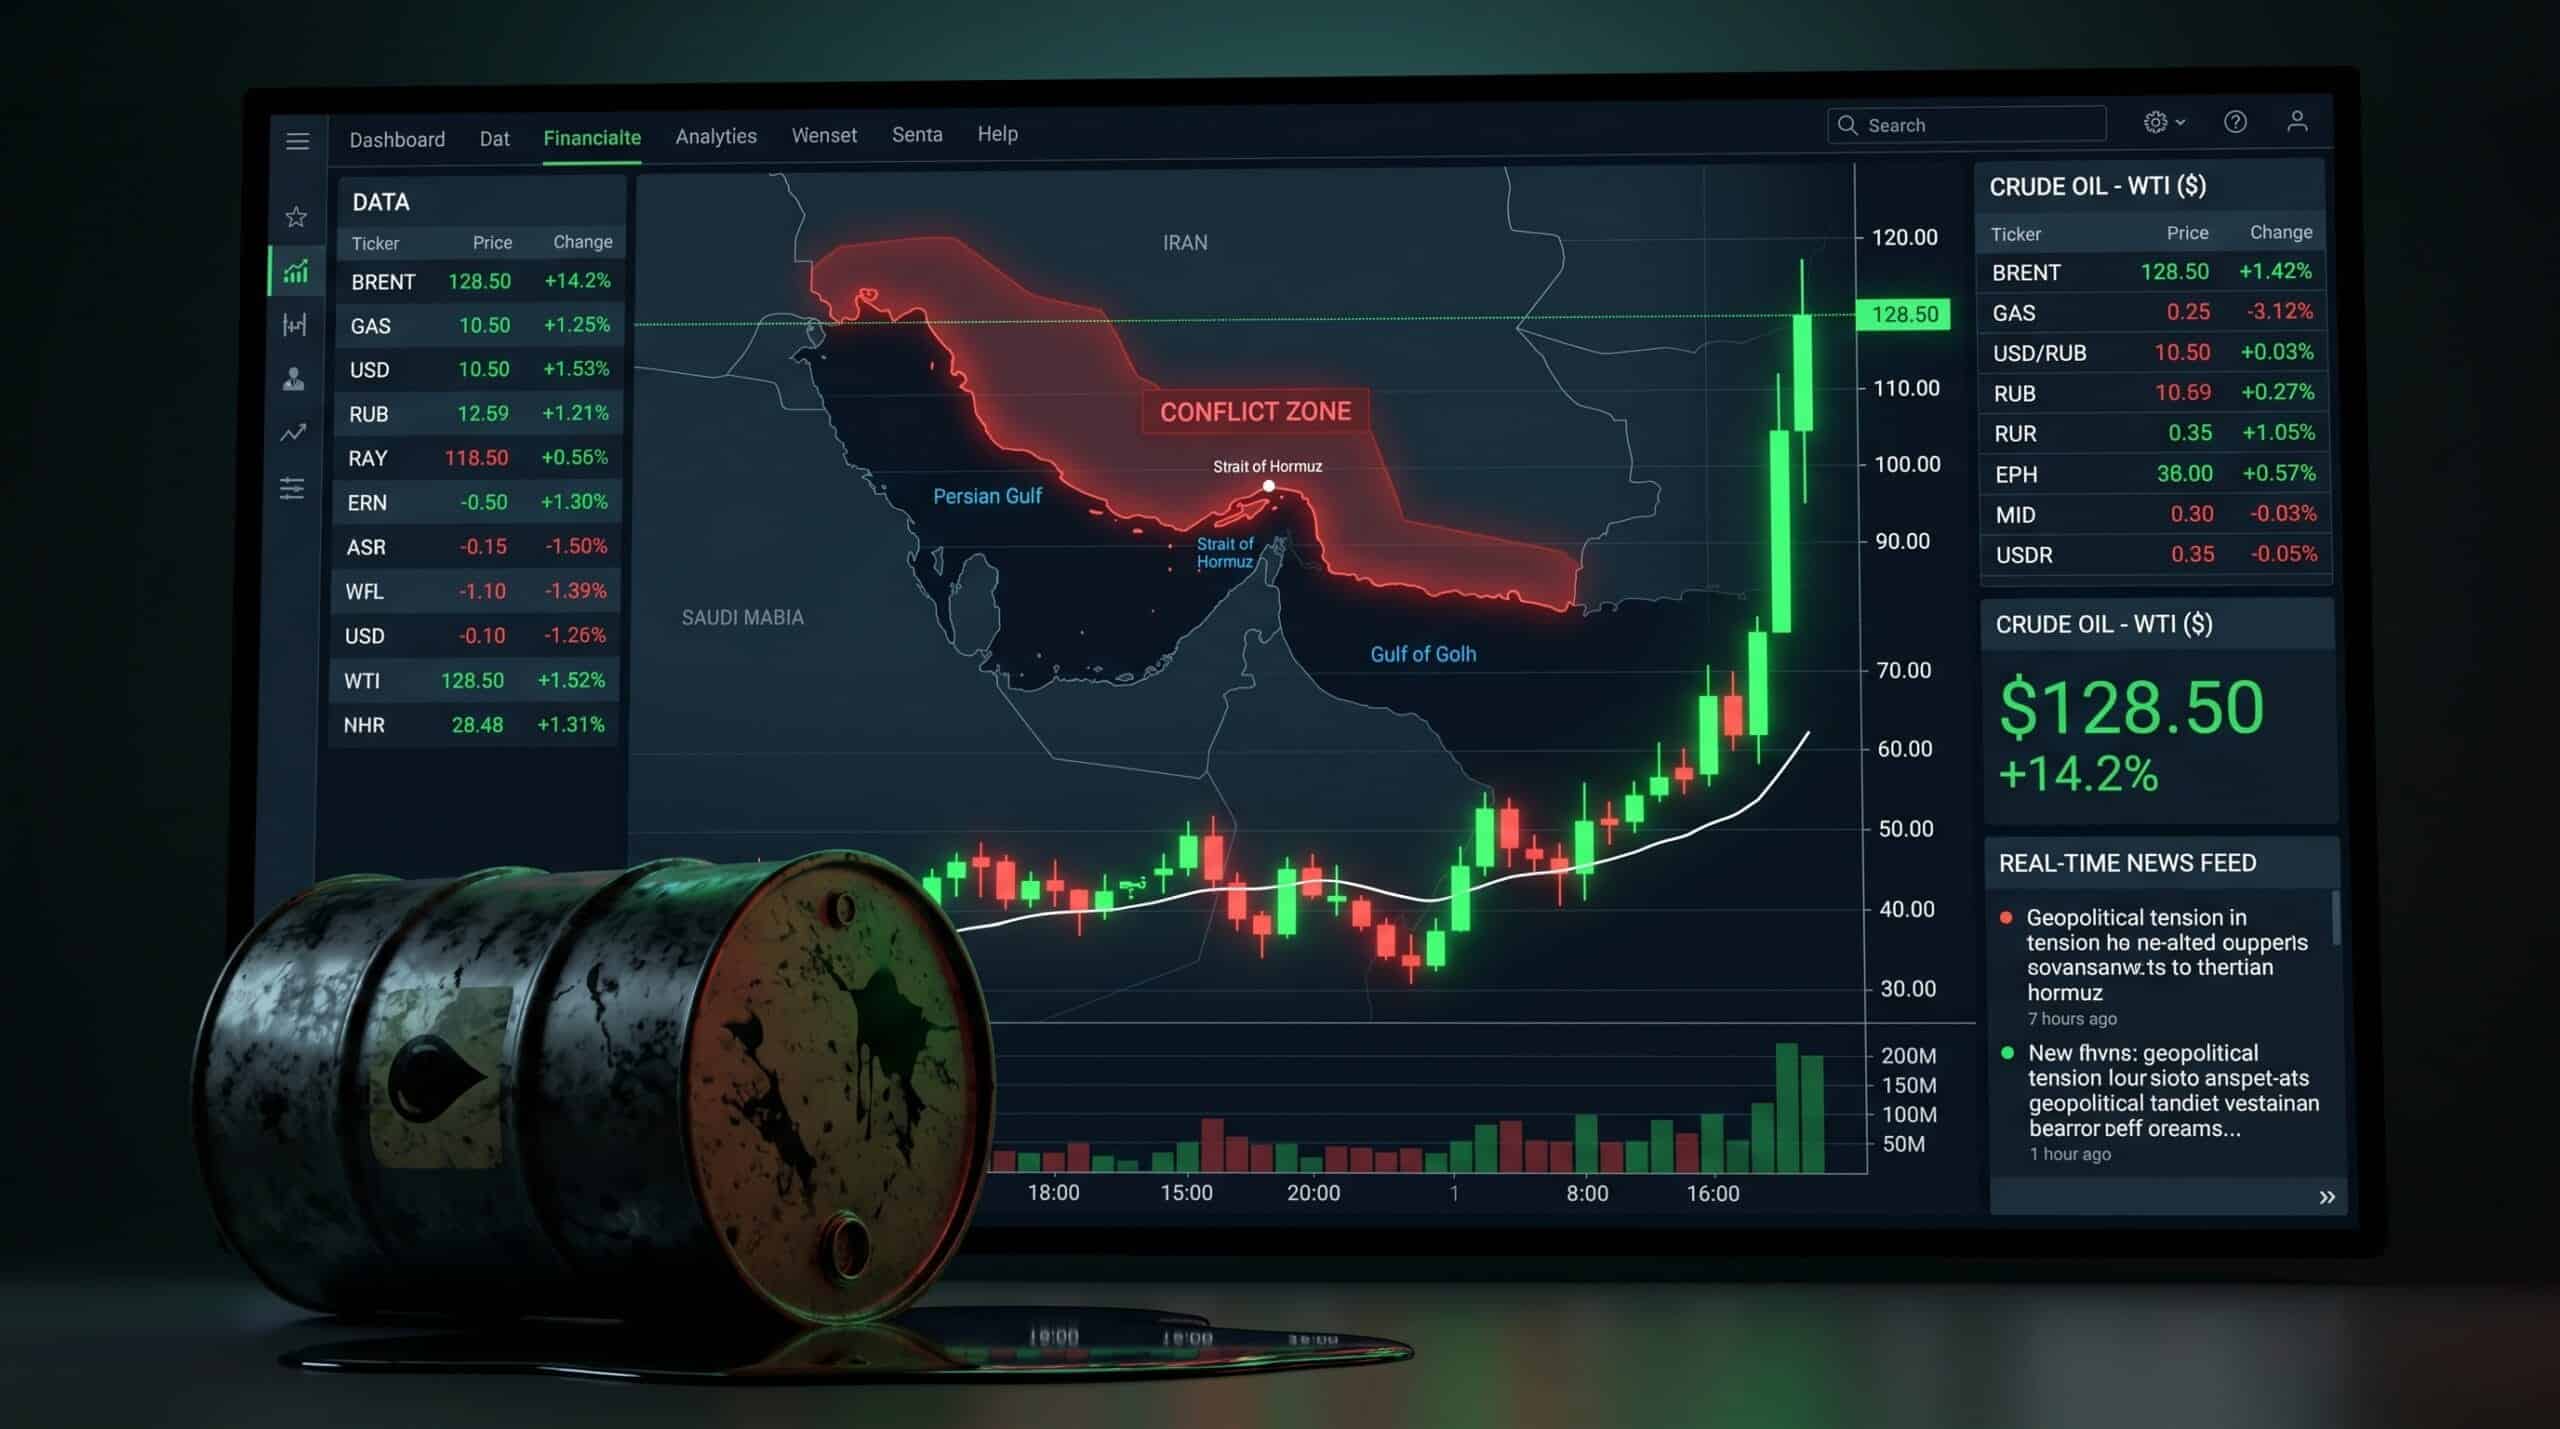
The oil price Iran war crisis has been one of the most dramatic market events of 2026. The oil price impact of the Iran war hit global energy markets hard. When the US and Israel launched strikes against Iran on February 28 and Iran subsequently closed the Strait of Hormuz to commercial shipping, global crude oil prices surged from approximately $85 per barrel to over $120 — a roughly 40% spike that sent shockwaves through every sector of the global economy.
This article examines how the 2026 Iran conflict has affected oil prices, which markets have been hit hardest, and what the reopening of the Strait of Hormuz means for energy prices going forward.
Why the Oil Price Iran War Connection Matters
The oil price impact of the Iran war is driven by one geographic fact: the Strait of Hormuz. Approximately 20-25% of the world’s seaborne oil and 20% of liquefied natural gas passes through this narrow waterway between Iran and Oman. When Iran closed the strait on March 2, 2026, it effectively removed a quarter of global maritime oil supply from the market.
Additionally, Iran itself is a significant oil producer — before the conflict, Iran exported approximately 1.5-2 million barrels per day. These exports were completely halted by the US naval blockade and the conflict itself, removing further supply from global markets.
Oil Price Iran War Timeline: Day-by-Day Price Movements
Key Oil Price Movements
- Pre-conflict (Feb 27): Brent crude ~$85/barrel
- Day 1 strikes (Feb 28): Immediate spike to ~$95, closing above $100
- Hormuz closure (Mar 2): Surged past $110 within hours
- Insurance pulled (Mar 5): Peaked near $125 as Lloyd’s removed war risk coverage
- Weeks 2-6 (Mar-Apr): Sustained above $110-120 range
- Hormuz reopened (Apr 17): Dropped sharply on the announcement
The oil price impact was not limited to crude oil. Natural gas prices also surged as Qatar — the world’s largest LNG exporter — was unable to ship through the Strait of Hormuz. European gas prices were particularly affected, raising concerns about energy security heading into the following winter season.
Which Markets Were Affected Most?
Energy Sector
Oil and gas companies saw their stock prices rise sharply. Defense contractors also benefited from increased military spending expectations. Energy ETFs significantly outperformed the broader market during the first weeks of the conflict.
Currencies
The Iranian rial collapsed to record lows against the dollar. Oil-importing nations like Japan, South Korea, and India saw their currencies weaken as their import bills surged. Conversely, oil-exporting currencies like the Russian ruble and Norwegian krone strengthened. You can track these movements on the TradingView ticker on our homepage.
Gold and Safe Havens
Gold prices surged above $3,100 per ounce as investors sought safe haven assets. Silver also rose significantly. US Treasury bonds saw increased demand, driving yields lower despite inflationary pressures from higher energy costs.
Broader Stock Markets
The S&P 500 dropped on recession fears driven by higher energy costs. Airlines, shipping companies, and transportation-dependent sectors were hit particularly hard. The uncertainty surrounding the conflict duration and potential for wider escalation kept volatility elevated throughout March and early April.
What the Hormuz Reopening Means for Oil Prices
On April 17, 2026, Iran declared the Strait of Hormuz “completely open” for commercial vessels. Oil prices dropped sharply on the announcement. However, several factors suggest the oil price impact of the Iran war is not over:
- US naval blockade continues — Iranian ports remain under US naval blockade, keeping Iranian oil exports offline
- Insurance recovery lag — war risk insurance premiums take time to normalize, meaning shipping costs remain elevated
- Ceasefire fragility — the ceasefire is temporary and could collapse, potentially leading to another Hormuz closure
- Inventory depletion — weeks of disrupted supply have depleted strategic petroleum reserves in consuming nations
- Tanker repositioning — it takes days to weeks for commercial shipping to resume normal patterns after a major disruption
Historical Comparison: Oil Prices and Gulf Conflicts
The oil price impact of the 2026 Iran war follows a pattern seen in previous Gulf conflicts, though the scale is unprecedented in the modern era:
- 1990 Gulf War: Oil doubled from ~$20 to ~$40 when Iraq invaded Kuwait and threatened Saudi oil fields
- 2003 Iraq War: Moderate price spike as markets had already priced in the invasion. Iraqi oil production was disrupted for years
- 2019 Abqaiq attack: Drone attacks on Saudi Aramco facilities temporarily removed 5% of global supply, causing a one-day 15% price spike
- 2026 Iran War: Most severe disruption since 1973 — approximately 20% of seaborne supply removed for 6+ weeks
Monitoring the Oil Price Impact
War Intel Hub provides several tools for monitoring the ongoing oil price impact of the Iran war:
- Homepage — live TradingView ticker showing Brent crude, WTI, gold, silver, and affected currencies in real-time
- Maritime Tracker — real-time Strait of Hormuz status and shipping activity
- Daily SITREPs — each report includes a market impact section covering energy and financial developments
- 3D Strike Map — visualize the conflict geographically to understand which oil infrastructure is at risk
Track Oil Markets and Conflict in Real Time
Live pricing, Hormuz status, and verified intelligence — all on one dashboard.
Open War Intel Hub →